有朋友问我是否能像 OpenWrt 上的 vnstat 那样,通过网页看 VPS 节点上 vnstat 生成的统计图。我个人的方案是通过比较简陋的脚本实现的(能用就行),已经在 VPS 上运行了很久了,这里简单分享一下具体过程。
其实就是使用脚本调用 vnstati 生成对应的图片文件,再渲染出一个简单的 index.html 文件,最后通过 nginx 提供 Web 服务。
简单的脚本 /opt/gen_vnstat_imgs.sh:
#!/bin/sh
VNSTAT_WWW=/data/vnstat_images
VNSTAT_DB=/var/lib/vnstat
BIN=/usr/bin/vnstati
IMGS="s h d t m"

mkdir -p $VNSTAT_WWW
interfaces="$(ls -1 $VNSTAT_DB)"

if [ -z "$interfaces" ]; then
    echo "No database found. Create new by command: vnstat -u -i eth0"
    exit 0
fi

for interface in $interfaces; do
    if [ "$interface" = "vnstat.db" ]; then
        continue
    fi

    for imgs in $IMGS; do
        $BIN -${imgs} -i $interface -o $VNSTAT_WWW/vnstat_${interface}_${imgs}.png
    done
done

if [ ! -f $VNSTAT_WWW/index.html ]; then
    cat > $VNSTAT_WWW/index.html << EOL
<META HTTP-EQUIV="refresh" CONTENT="300">
<html>
  <head>
    <title>Traffic of Interface(s)</title>
  </head>
  <body>
EOL
    for interface in $interfaces; do
        cat >> $VNSTAT_WWW/index.html << EOL
    <h2>Traffic of Interface ${interface}</h2>
    <table>
        <tbody>
            <tr>
                <td>
                    <img src="vnstat_${interface}_s.png" alt="${interface} Summary" />
                </td>
                <td>
                    <img src="vnstat_${interface}_h.png" alt="${interface} Hourly" />
                </td>
            </tr>
            <tr>
                <td valign="top">
                    <img src="vnstat_${interface}_d.png" alt="${interface} Daily" />
                </td>
                <td valign="top">
                    <img src="vnstat_${interface}_t.png" alt="${interface} Top 10" />
                    <img src="vnstat_${interface}_m.png" alt="${interface} Monthly" style="margin-top:5px;"/>
                </td>
            </tr>
        </tbody>
    </table>
EOL
    done
    cat >> $VNSTAT_WWW/index.html << EOL
  </body>
</html>
EOL
    fi
个人 VPS 上目前运行的是 Debian 11,部署在不同发行版的话,脚本中一些变量读者可以自行修改以匹配自己的实际情况。
配置一下定时任务,定时生成新的统计图,我这里是 30 分钟一次:
*/30 * * * * /opt/gen_vnstat_imgs.sh
nginx 的配置非常简单:
server {
    listen *:443 ssl http2;
    server_name  abc.com;

    location ^~ /bw {
        alias /data/vnstat_images/;
        index index.html;
    }
}
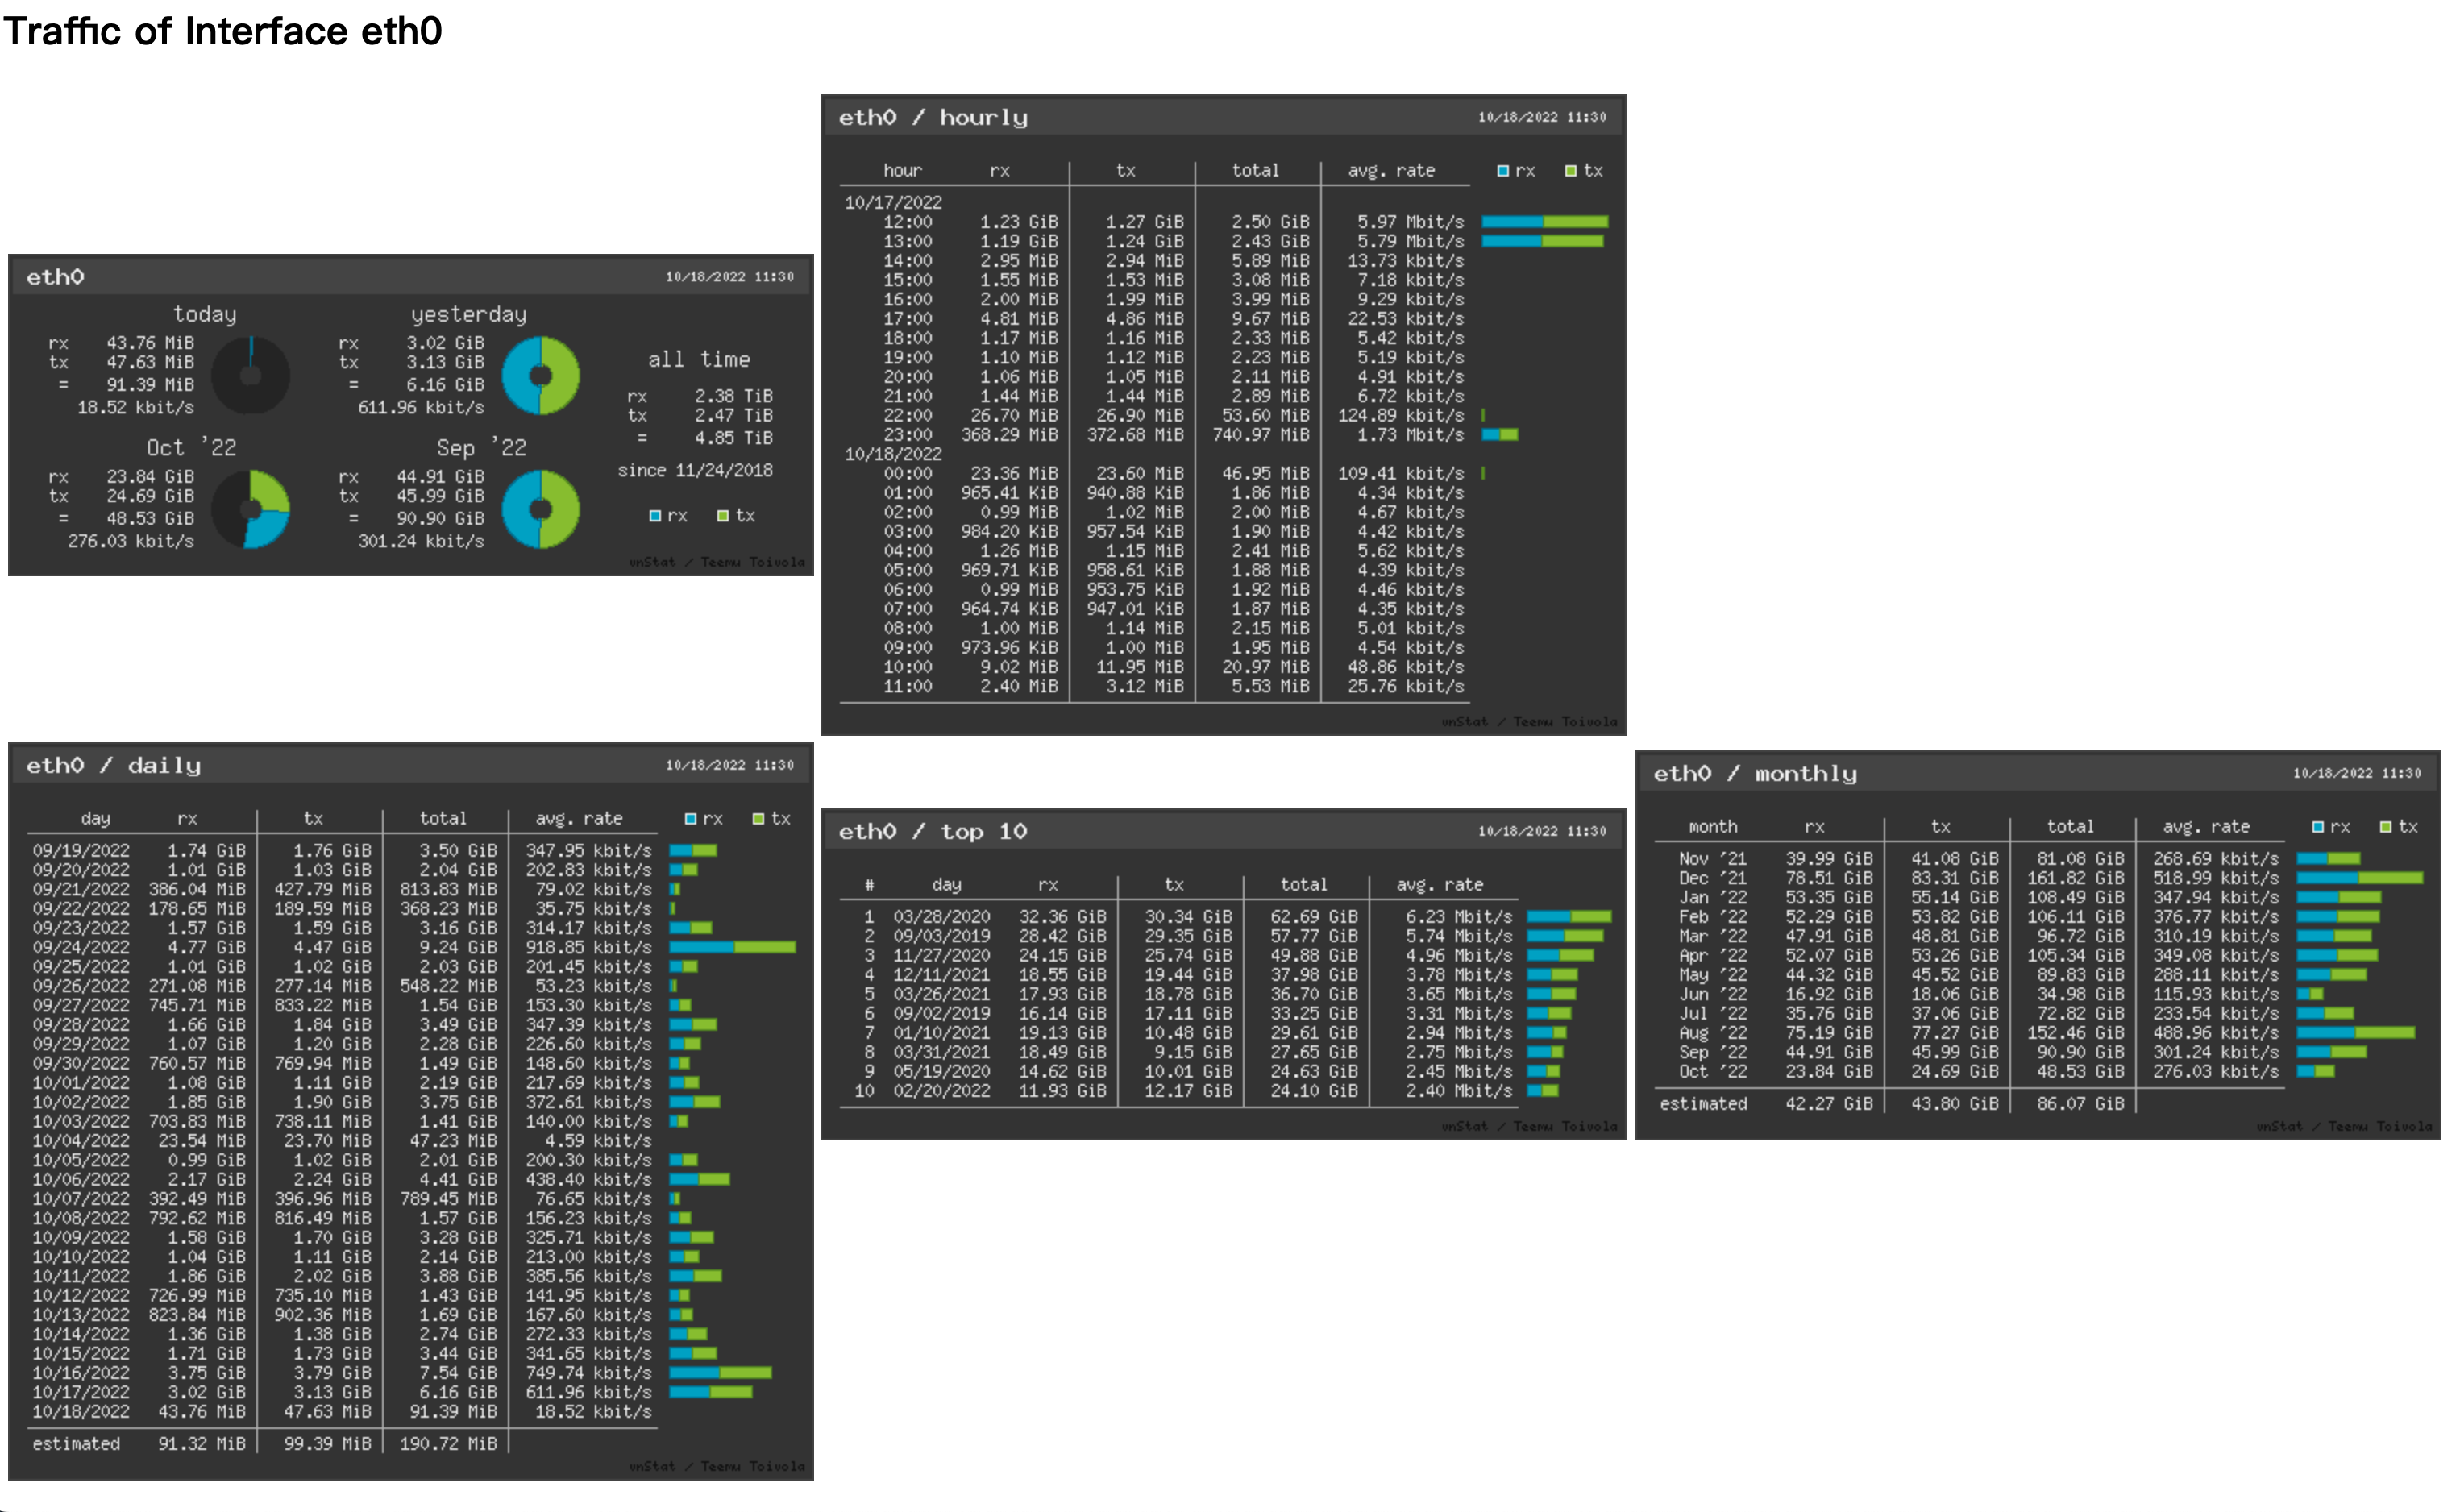
最后附一张效果图,忽略这丑陋的排版,能用就行 :)